MAPI Survey on the Business Outlook: Index slips slightly
Composite index falls to 55 from 56, the 13th straight quarter above 50, yet the 10th consecutive decline.
Latest Material Handling News
IFR: robot installations by U.S. manufacturing companies up 12 percent last year Geek+ and System Teknik deploy PopPick solution for pharmacy group Med24.dk Beckhoff USA opens new office in Austin, Texas Manhattan Associates selects TeamViewer as partner for warehouse vision picking ASME Foundation wins grant for technical workforce development More NewsThe results of the quarterly Manufacturers Alliance for Productivity and Innovation (MAPI) Survey on the Business Outlook (EO-118) indicate little change from the previous report—namely that the sector continues to grow, but at a nominal pace as it confronts ongoing challenges.
The survey’s composite index is a leading indicator for the manufacturing sector. The December 2012 composite index fell to 55 from 56 in the September 2012 survey. Despite the decline—its 10th straight since reaching a record high of 81 in June 2010—the index remains above the threshold of 50, the dividing line that separates contraction and expansion. The drop of only 1 percentage point may portend some stabilization, and is below the fairly significant 5 percentage point drop in the September survey, the largest over the 10-quarter decline.
“Movements in the individual indexes were mixed, but most of the forward looking indexes showed some, if marginal, improvement,” said Donald A. Norman, Ph.D., MAPI senior economist and survey coordinator. “The rapid slowdown in the growth of manufacturing production that began in March 2012 appears to have bottomed out and the outlook is for slow expansion over the next three to six months.”
The Composite Business Outlook Index is a weighted sum of the Prospective U.S. Shipments, Backlog Orders, Inventory, and Profit Margin Indexes. In addition to the composite index, which reflects the views of 55 senior financial executives representing a broad range of manufacturing industries, the survey includes 13 individual indexes that are split between current business conditions and forward looking prospects.
Overall, 6 of those 13 indexes decreased, including 4 of the 6 current business condition indexes, and 1 remained flat.
The Capacity Utilization Index, which shows the percentage of firms operating above 85 percent of capacity, was a bright spot, climbing to 31.5 percent in December from 28.8 percent in September. It is near its long-term average of 32 percent.
The Current Orders Index, a comparison of expected orders in the fourth quarter of 2012 with those in the same quarter one year ago, remained at 57 from the previous survey.
The Backlog Orders Index, which compares the fourth quarter 2012 backlog of orders with that of one year earlier, fell to 45 from 53 in the September report.
The Profit Margin Index also slipped, to 59 in December from 67 in September.
Based on a comparison of inventory levels in the fourth quarter of 2012 with those in the fourth quarter of 2011, the Inventory Index dropped to 54 in December from 58 in September, a sign that manufacturers are paring inventories in response to slowing growth.
The Export Orders Index, which compares exports in the fourth quarter of 2012 with the same quarter in 2011, also saw a slight decline, to 49 in the current survey from 53 in the previous report.
Five of the seven forward looking indexes showed improvement.
The Prospective U.S. Shipments Index, which reflects expectations for first quarter 2013 shipments compared with the first quarter of 2012, climbed to 63 in December from 60 in September. The Prospective Non-U.S. Shipments Index, which measures expectations for shipments abroad by foreign affiliates of U.S. firms for the same time frame, rose to 57 in the current report from 56 in the September survey.
The Annual Orders Index, based on a comparison of expected orders for all of 2013 with orders in 2012, improved to 78 in December from 75 in September.
The U.S. Investment Index is based on executives’ expectations regarding domestic capital investment for 2013 compared to 2012. The index was 56 in December, a marginal increase from 54 in the September survey. The Non-U.S. Investment Index, based on projections regarding capital expenditures abroad in 2013 compared to 2012, fell to 59 in the current report from 60 in September.
The Research and Development Spending Index surveys participants regarding R&D spending in 2013 compared to 2012. The index was 69 in the December report compared with 68 in September.
The Interest Rate Expectations Index decreased to 51 from 56, yet still indicates that a majority believe that longer-term interest rates will rise by the end of the first quarter of 2013.
In a supplemental section, participants were queried on the prospects for reshoring, or bringing operations back to the United States from abroad.
Seven of 42 respondent firms, or 16.7 percent, with manufacturing operations located outside the United States have returned some of those operations back to the U.S. in the last 24 months. All of the activity was returned to existing plants.
Of the operations that have returned, two-thirds (67 percent) have been relatively small in terms of investment and jobs. The primary reasons for reshoring are a declining labor cost advantage abroad, rising shipping costs, and the desire to reduce supply chain uncertainty.
The primary reason companies are not returning operations to the U.S. is the need for a platform to sell into local markets.
MAPI’s Composite Business Outlook Index (see chart below) is a historically accurate near-term preview of business prospects for the manufacturing sector and is a leading indicator of the Federal Reserve’s industrial production index.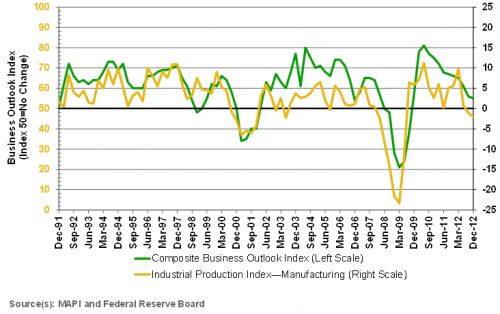

Article Topics
Latest in Materials Handling
IFR: robot installations by U.S. manufacturing companies up 12 percent last year Geek+ and System Teknik deploy PopPick solution for pharmacy group Med24.dk Beckhoff USA opens new office in Austin, Texas Manhattan Associates selects TeamViewer as partner for warehouse vision picking ASME Foundation wins grant for technical workforce development The (Not So) Secret Weapons: How Key Cabinets and Asset Management Lockers Are Changing Supply Chain Operations MODEX C-Suite Interview with Harold Vanasse: The perfect blend of automation and sustainability More Materials HandlingSubscribe to Materials Handling Magazine

Find out what the world's most innovative companies are doing to improve productivity in their plants and distribution centers.
Start your FREE subscription today.
April 2024 Modern Materials Handling

Latest Resources