Don’t Believe the Hype: A Call for Responsible Supply Chain Analytics – Part 4 of 5
How supply chain managers can cut through the data hype, ask the right questions, and rely on more responsible analytics in today’s uncertain business environment

This is the fourth of five articles that breaks down the key issues that all supply chain managers should focus on as they emerge from COVID-19 and carve a path forward for their organizations. You can read Part 1 here, Part 2 here and Part 3 here.
If you’ve looked at the news headlines lately, you’ve probably seen an abundance of reports, charts and individual opinions about the global pandemic and its near- and far-reaching economic impacts. Using analytics to tell their stories, these reports and individuals have offered a lifeline for many, yet not all paint an accurate, actionable picture for supply chain managers to rely (and act) on.
In July and August, for example, business headlines temporarily swung in a positive direction—telling us that the economy was rebounding despite the fact that many Americans remained unemployed and big pharma is yet to commercialize a COVID-19 vaccine. According to industry reports, the PMI index (a measure of manufacturing and service activity) “rose to 54.7 from 50.3 in July, an 18-month high.” At first glance, this suggests significant improvements in the economy, yet these numbers might not capture the unique effects of this pandemic given the way in which a diffusion index like the PMI is calculated: heavily skewed towards large firm managers and specifically, their impressions of month-over-month changes in new orders, production outputs, prices, etc.
With its emphasis on “change,” it is easy to appreciate the power of the PMI Index during normal times. However, when the industry is dealing with abnormal macroeconomic situations such as the current COVID-19 pandemic, the information provided by these comparisons must be considered carefully. That “change” or diffusion emphasis could also mean these July/August numbers reflect momentum, wherein you can have very large positive readings on the other side of a collapse while real activity is still down. This by no means diminishes the value of such indices, just a statement of caution for supply chain managers to remember to wait and re-evaluate what productivity numbers look like on the other side of this pandemic before drawing any final conclusions.
Rapid reporting, in terms of very timely data, should be taken in proportional consideration with its relative accuracy. More accurate numbers typically suffer a lag while more timely data might not pick up on long-term trends. It’s also important to remember the media effects on reporting because bad news gets more attention than good news, with negative headlines attracting more eyeballs than positive ones (this can also work in reverse).
Don’t take charts at face value
As an industry, supply chain management has been pushing for the importance of data analytics skills particularly for more of its incoming job candidates. These future generation professionals are challenged to learn how to gather data, clean it up, assess it, extract certain points from it, and then make accurate conclusions based on that information. For individuals who may not be so analytically-inclined, however, is there a propensity to believe all the results, numbers, and statistics that are put in front of them?
Take for example, a recent WSJ report citing the US Census Bureau and Federal Reserve Bank of St. Louis data on the inventory to sales ratio with an interpretation that suggest that businesses “stockpiled more goods during the coronavirus pandemic … to ward against shortages caused by snarled transportation routes and other supply-chain difficulties.” The article goes on to state that “transportation constraints have helped push companies to add more inventory.”
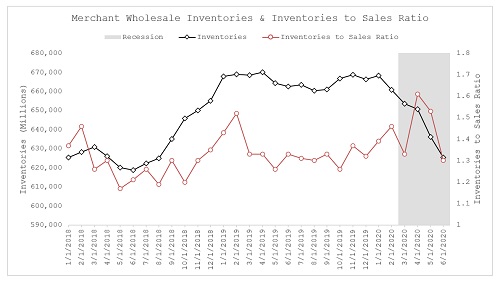
Interpreting an increase in the inventory to sales ratio to indicate that companies are stocking up on inventories can be misleading, as a closer inspection of the full data series suggests that while the monthly inventory to sales ratio for all US businesses rose during this March through June period, inventory levels – by themselves did not increase during this period, rather sales plummeted (Figure 1).
Figure 1: Comparing Inventory Volumes with the Inventory to Sales Ratio, 2018-2020 *
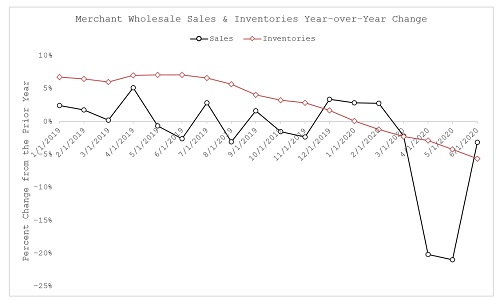
Comparing inventory levels separate from sales on a year over year basis would have shown that inventory levels have actually been falling since the COVID-19 pandemic began while sales volumes are much further down. Closer inspection of even more recent data also shows that sales are recently experiencing an uptick while inventory levels continue to trend down (Figure 2). This provides a different conclusion from the article, in fact suggesting the opposite: that firms actually spent the immediate post-pandemic period liquidating inventory, not stocking up on it.
Figure 2: YoY Percent Change in Inventory Levels and Sales*
Responsible analytics
The total amount of data created, captured, copied and consumed in the world is forecast to increase rapidly, reaching 59 zettabytes in 2020 (up from 41 zettabytes in 2010). It’s on track to reach 149 zettabytes by 2023. These are pretty big numbers that all supply chain managers should be paying attention to, as they continue to work through their current challenges, and plan for the future.
Pummeled by data from all angles, logistics and supply chain managers must decide which points deserve further assessment and which should just be ignored. Taking results at face value can be misleading and sometimes dangerous in a world where data is proliferating at unprecedented rates. Investigate the source of the data and don’t be afraid to question it.
For example, if your company is paying for monthly reports, and your gut tells you something doesn’t feel quite right about what you’re reading, then it’s time to start asking the tough questions. This isn’t always easy because it goes against the grain of what we’ve been taught (namely, that numbers and statistics are produced in somewhat of a “magical” way that shouldn’t be questioned). For others, a fear of numbers keeps them from asking critical questions about the data, even when those numbers don’t make sense. Many of us are too quick to automatically assume that our lack of analytics skillsets is causing the confusion.
This applies to both analytical and non-analytical professionals, both of which bring their own levels of expertise, experience, and industry savvy to the table. They know industry trends, understand the warning signs, and are experienced in evaluating the typical “what-if” scenarios that help make good supply chain decisions. When that snazzy chart or complex report doesn’t align with these foundational elements, it’s time to question the former instead of being stricken by a fear of numbers, analytics, or technology.
A good place to start is by asking your data provider to generate data, analytics and reports that are 1) useful to your organization and 2) understandable and actionable. If the data you’re getting is being generated at a macro level and, as such, of no relevance to your company, ask your provider for more granular reporting.
If, for example, you’re running the supply chain for a food manufacturer—and if the data you’re receiving only addresses the broader food sector—then inquire about food producing sub-sectors of interest within the overall, aggregate sector. In many cases, getting the answers you need comes down to one simple question: What do I do if I’m a
company? This will push your data providers to dig down deeper to get to the actual, useful numbers and will along the way help create an environment of more responsible analytics usage.
Careful consideration is essential
The data accuracy conundrum isn’t limited to the information sources that you pay for. Supply chain professionals should also be wary of non-intuitive data definitions and remember how indices and ratios are calculated as illustrated earlier. When assessing information sources, be cautious about measures like month-over-month or quarter-over-quarter comparisons. During normal times, discussing how data changes on a monthly basis may make sense. However, these are not “normal times,” and any information based on these types of comparisons deserves careful consideration.
There is clearly a tradeoff between getting fast-paced, recent data and getting data that tells a complete story. In the short term, recent data is good to have. On the other hand, seeing how trends perform over time (looking backwards) has a huge potential for learning. Supply chain managers need to get comfortable enough with analytics to freely ask questions like “How is the data collected?” “What is the size and diversity represented in the data sample?” “What adjustments have been made (or need to be made) to the data for its effective use and interpretation?”
Understanding data flaws and potential weaknesses is also essential. And finally (and some would argue most importantly), please look beyond the provided visualizations. Snazzy charts are cool and all, but what’s your story from this data? Keep these points in mind as you review the latest data points and decide how to apply them to your own situation (or, simply when to ignore them).
About the author: Yemisi Bolumole, Ph.D., CLTD-F is Associate Professor of Supply Chain Management at the Eli Broad College of Business, Michigan State University. Her areas of research emphasis include the policy and public sector implications for supply chain managers. A regular speaker at sundry professional events, Bolumole currently serves as Chair of ASCM/APICS’ CLTD certification exam committee.
*All data obtained from US Census Bureau’s Monthly Wholesale Trade Survey

Article Topics
Blogs News & Resources
Learn from lift truck service history Two voices of reason on pallet materials 60 Seconds with Bob Trebilcock, outgoing executive editor, Modern Materials Handling The reBound Podcast: How Pitney-Bowes is innovating with autonomous vehicles. Packaging Corner: Be open to change 60 Seconds with Robert Martichenko of American Logistics Aid Network The reBound Podcast: Looking for talent in all the right places: How Essendant is revolutionizing recruitment More BlogsLatest in Materials Handling
Geek+ and System Teknik deploy PopPick solution for pharmacy group Med24.dk Beckhoff USA opens new office in Austin, Texas Manhattan Associates selects TeamViewer as partner for warehouse vision picking ASME Foundation wins grant for technical workforce development The (Not So) Secret Weapons: How Key Cabinets and Asset Management Lockers Are Changing Supply Chain Operations MODEX C-Suite Interview with Harold Vanasse: The perfect blend of automation and sustainability Consultant and industry leader John M. Hill passes on at age 86 More Materials HandlingSubscribe to Materials Handling Magazine

Find out what the world's most innovative companies are doing to improve productivity in their plants and distribution centers.
Start your FREE subscription today.
April 2024 Modern Materials Handling

Latest Resources