MAPI Business Outlook: A sense of optimism for manufacturers
Composite Index jumps to 66 from 58 -- highest in seven quarters and third consecutive advance; senior financial executives surveyed on interest rates and tapering.
Latest Material Handling News
ALAN opens nominations for 2024 Humanitarian Logistics Awards Kenco to install an AutoStore system at its Jeffersonville, Ind., DC Schneider Electric rolling out WMS and TMS solutions from Manhattan Associates at scale Tom Panzarella appointed Chief Technology Officer at Seegrid Mallard Manufacturing joins the MacLean-Fogg family of companies More NewsWidespread improvement in a number of indexes suggests optimism for the manufacturing sector in the next three to six months, according to the quarterly Manufacturers Alliance for Productivity and Innovation (MAPI) Business Outlook.
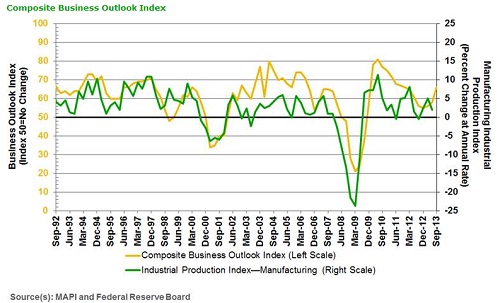
The survey’s composite index is a leading indicator for the manufacturing sector. The September 2013 composite index advanced to 66 from 58 in the June survey, the third straight quarterly advance and the highest level since the December 2011 reading of 66. For 16 quarters, the index has remained above the threshold of 50, the dividing line separating contraction and expansion.
“Most indexes improved in September, and several rose significantly,” noted Donald A. Norman, Ph.D., MAPI senior economist and survey coordinator. “In particular, the large increase in the Composite Index and the jump in the U.S. Prospective Shipments and the Backlog Orders indexes point to an increased pace of manufacturing activity in the fourth quarter.”
The Composite Business Outlook Index is based on a weighted sum of the Prospective U.S. Shipments, Backlog Orders, Inventory, and Profit Margin Indexes. The views of 51 senior financial executives representing a broad range of manufacturing industries are distilled into 13 individual indexes split between current business conditions and forward looking prospects. Of those 13 indexes, 9 individual indexes increased and 4 declined.
Current Business Condition Indexes
● The Current Orders Index, a comparison of expected orders in the third quarter of 2013 with those in the same quarter one year ago, shot up to 70 from 53 in the previous report. The Export Orders Index, which examines the same time frame, rose to 61 from 45.
● Another double-digit jump was seen in the Profit Margin Index, increasing to 68 in September from 56 in June.
● The Capacity Utilization Index, which measures the percentage of firms operating above 85% of capacity, increased to 30% in September from 21.2% in June; its long-term average is 32%.
● The Backlog Orders Index, which compares the third quarter 2013 backlog of orders with that of one year earlier, rose to 59 from 54.
● The Inventory Index, based on a comparison of inventory levels in the third quarter of 2013 with those in the third quarter of 2012, dropped to 49 in September from 51 in June. This suggests that companies are neither drawing down nor building inventories.
Forward Looking Indexes
● The Prospective U.S. Shipments Index, which reflects expectations for fourth quarter 2013 shipments compared with those in the fourth quarter of 2012, increased to 76 in September from 67 in June. ● ● The Prospective Non-U.S. Shipments Index, which measures expectations for shipments abroad by foreign affiliates of U.S. firms for the same time frame, advanced to 70 from 60 in the June survey.
● The Annual Orders Index, which is based on a comparison of expected orders for all of 2014 with orders in 2013, was a bright spot, increasing to 81 in September from 64 in June.
● The Interest Rate Expectations Index fell to 71 from 81, indicating that fewer respondents believe that longer-term interest rates will rise by the end of the fourth quarter of 2013.
● The U.S. Investment Index is based on executives’ expectations regarding domestic capital investment for 2014 compared to 2013. The index was 53 in September, a drop from 65 in June. The Non-U.S. Investment Index inched up to 54 in the current report from 53 in June.
● The Research and Development Spending Index was 66 in September, a decrease from 73 in June; this index compared anticipated spending for the years 2013 and 2014.
In a supplemental section, participants were queried on the impacts that low interest rates are having on companies and the timing and effects of the Federal Reserve Board’s intent to taper its quantitative easing (QE) program. Ninety-one percent reported that their companies have seen their pension liabilities increase because of low interest rates, with 56% reporting that the increase has been significant. Sixty-one percent have had to add to their pension reserves because low interest rates have raised pension liabilities. Finally, 64% indicated that the Fed’s tapering of its QE program will have a moderately negative impact on the economy; 30% expect little, if any, impact.
MAPI’s Composite Business Outlook Index is a historically accurate near-term preview of business prospects for the manufacturing sector and is a leading indicator of the Federal Reserve’s industrial production index.

Article Topics
Latest in Materials Handling
ALAN opens nominations for 2024 Humanitarian Logistics Awards Kenco to install an AutoStore system at its Jeffersonville, Ind., DC Schneider Electric rolling out WMS and TMS solutions from Manhattan Associates at scale Leaders Q & A with Bryan Ferguson: Resurgence of RFID technology Tom Panzarella appointed Chief Technology Officer at Seegrid Mallard Manufacturing joins the MacLean-Fogg family of companies Boscov’s: Speed regained in retail distribution More Materials HandlingSubscribe to Materials Handling Magazine

Find out what the world's most innovative companies are doing to improve productivity in their plants and distribution centers.
Start your FREE subscription today.
May 2024 Modern Materials Handling

Latest Resources