Materials Handling Salary Survey 2020: Satisfaction on the rise
We asked and you told us what you’re paid and where you see your career path heading. And, considering all that’s happened in the past few months, you’re generally upbeat. Read on to see where you fit in our survey.


Who doesn’t like a good salary survey? After all, it’s always interesting to see how you stack up with your peers when it comes to money. But as we all know, there’s much more to a sense of fulfillment from your job than just dollars and cents. And, at no time has that been more true than in the past few months.
So, let’s start with the top line numbers.
Average base annual salary for 2020 came in at $114,773. The median salary is $98,000. That’s according to the 309 respondents to an annual survey done for Modern Materials Handling (a Peerless Media publication) by its affiliate Peerless Research Group (PRG). The survey was conducted late summer, and has a margin of error of ±5.6%.
Job functions covered by the survey are broad, as are the corresponding salaries. As would be expected, company management receives the highest compensation at more than $166,000 annually. That’s followed by plant management at $109,000, engineering at $101,000, purchasing at $95,000 and warehouse management at $92,000.
Overall, 65% of respondents say their salary increase in the past year was less than 5%. Meanwhile, 17% of respondents got 5% to 9% bumps and a quite surprising 18% got a 10% plus bump. Although the survey did not tie increases to promotions, you’ve to assume those higher numbers were for promotions.
Then there’s the matter of bonuses and commissions. In 2020, the smallest percentage of people surveyed (71%) received one or the other during the past four years. The average bonus/commission is just more than $24,500 and the median is $13,000. Compared to 2019, those numbers stayed the same for 52% of respondents, decreased for 22% and increased for 27%. That’s a surprising degree of stability given all the uncertainties we’re living with these days.
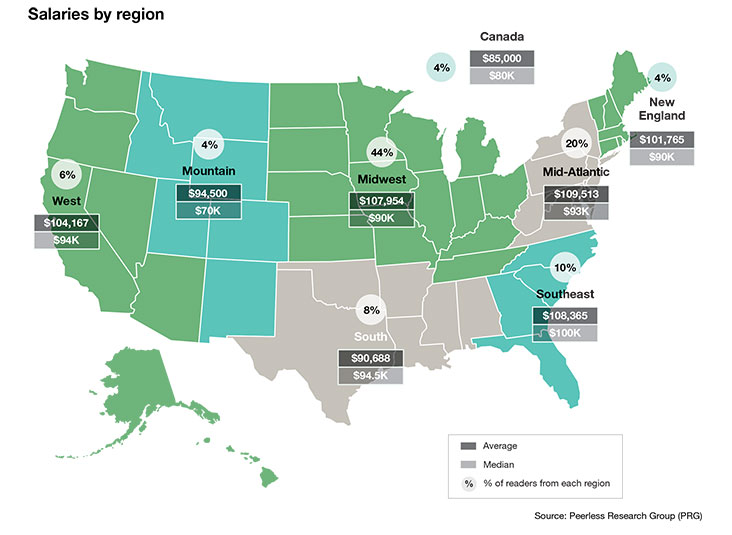
While the national numbers are a good starting point, the map above breaks average and median salaries down into eight geographic regions. Just to summarize, every region except Mountain and South cracks $100,000, with the mid-Atlantic leading the way at more than $109,000. The Southeast has the highest median salary ($100,000), while the Mountain region is lowest ($70,000).
New England was the only region that saw a drop off in salaries from 2019, while the mid-Atlantic and Southeast led the nation with their increases. All other regions were relatively stable year over year.
But as we said earlier, there’s more to all of this than just salaries, there’s also job satisfaction. And, you’re a highly satisfied bunch if you do say so yourself. Ninety two percent say you like your current job. That’s a nice increase from the 85% who were as upbeat just a year ago, which was the lowest “like” number of the past four years.
Breaking down salaries
As we all know, averages and medians are good initial indicators, but there’s much more to salaries, from education and years of experience to level of responsibilities. Here’s the breakdown.
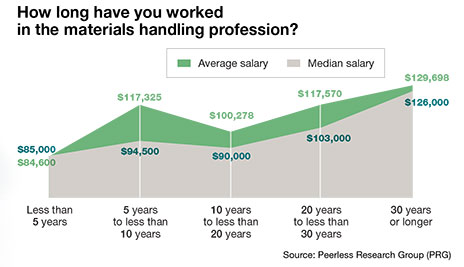
We’ll start with time in the materials handling profession. The chart on p. 34 shows exactly what you would expect. The more experience you have, the higher the pay. It’s true for both average and median salaries. By point of comparison, the average salary for people with 30 years and more experience is $129,698 compared to an overall average for all respondents of $114,773.
While that’s all about time in the profession, what about time at a company or companies? Turns out the more you move, the higher your salary. The average number of companies that respondents have worked at is 2.5, if such a thing is possible other than statistically. But you get the point.
In fact, staying with the same company is the worst salary move with an average salary of just $93,594, a decrease from past years. Working at more than five companies brings in an average salary of $137,598. Median salaries follow the same pattern. By the way, these numbers are irrespective of time in the profession and are based solely on number of companies.
In case you were wondering, the average number of years at a person’s current employer is 10.3 in 2020. That number has bounced between 10.0 last year and 10.9 in 2018. In other words, you aren’t working in a profession full of two-years-and-move wonders, despite how it might feel some days. By the way, the average salary sweet spot is for those who stay three to five years at a company, coming in at just more than $125,000.
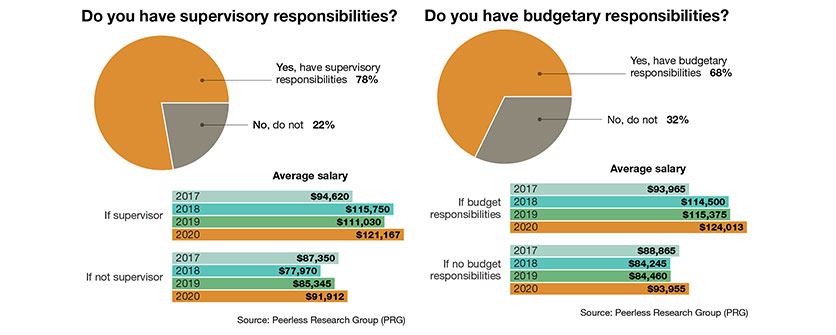
Then there’s supervisory responsibilities. As the chart above shows, the vast majority (78%) supervise others, and salaries reflect that. Average salary for those respondents is just more than $121,167. For the other 22%, dollars come in at just $91,912.
Budgetary responsibilities also contribute nicely to average salaries. The 68% of respondents who manage budgets make more than a 30% premium.
How big are those budgets? They range all over the place with 62% of people with this responsibility managing less than $50,000 annually. The next important cluster is in the $100,000 to $499,999 range with 14% having budgets that size. A full 10% manage budgets of $1 million and more. Take all of this together and the average budget size is roughly $215,000 and the median almost $28,000.
Beyond salary
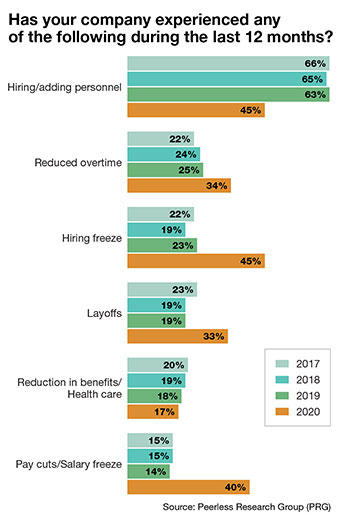 Now for the not so upbeat part of the survey. The Covid-19 pandemic has had an impact on companies and how they operate. While the impact of Covid was not asked specifically, it’s easy to surmise that is the cause of the downside here. The chart on the left details shifts here during the past four years.
In this year’s numbers, 45% of respondents report a hiring freeze at their company. That’s double the number last year, which was up 20% compared to 2018. Meanwhile, 33% experienced layoffs at their companies, more than a 70% increase over the 2019 survey.
However, it’s important to put those numbers in perspective. The survey asked “has your company experienced….” So those numbers are company wide. When asked “have you personally been affected by layoffs in the past 12 months?” 8% said “yes.” That’s a single percentage point increase over survey results in 2019 and in 2018. Furthermore, no one who responded to the survey had personally been laid off. Otherwise, they would not have received the survey in the first place.
Pay cuts in different forms are widespread, however. A third of companies reduced overtime while 40% instituted either pay cuts or a salary freeze. Seventeen percent endured a reduction in benefits including health care. Again, these are company-wide numbers.
All of that said, 96% would recommend the materials handling profession to others. That’s the highest number since before 2017, with the past four years all registering a greater than 90% level of recommending the profession.
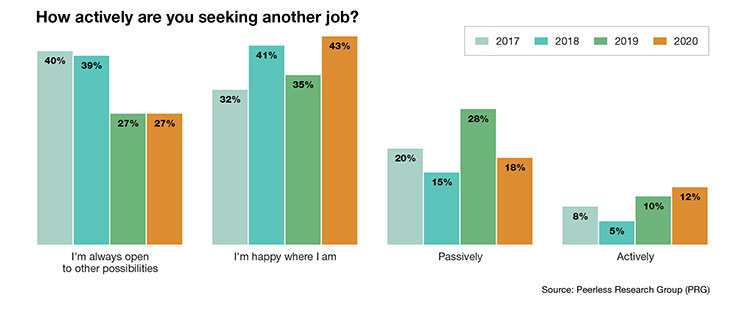
But as we know, people do move around in the materials handling profession. After all, 10.3 years does not a career make. So, how interested are people in finding another job right now?
 So, 12% of respondents are actively looking, slightly more than last year, but more than twice the level of 2018. Meanwhile, 18% are passively looking, a 10-percentage-point drop from last year. Another 43% say “I’m happy where I am,” the highest level in the past four surveys.
Why are they looking? There’s a whole range of reasons from compensation (No. 1 of 10 reasons) to my company is outsourcing work (No. 10). Respondents could check as many reasons for looking as they wanted. And they did.
The top three reasons—compensation (48%), looking for new challenges (43%) and lack of advancement opportunities (38%)—tally up to well more than 100%. By the way, compensation is 5 percentage points below a year ago while new challenges is up 6 percentage points, and lack of opportunity rose 5 percentage points. Job security (No. 6) comes in at 15%. Too long a commute (No. 7) is 13%, notable considering all the recent discussion about working at home.
This report would not be complete without a few words about job related stress. Fifteen percent of respondents say their job is extremely stressful while 28% say very stressful and 45% say somewhat stressful. The final 12% say the job is not very or not at all stressful.
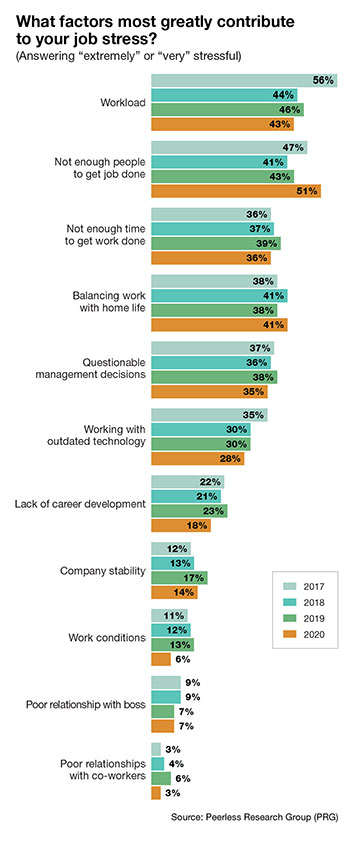
So, where is the stress coming from? “Not enough people to get the job done” is top of the list with 51% citing it. That sore spot is also the largest gainer as a source of stress compared to 2019, climbing 8 percentage points. No. 2 on the stress list is workload at 43%, a decline of 3 percentage points year over year. No. 3 is “not enough time to get work done” at 36%, a 3-percentage-point decline.
On the surface, it’s a little difficult to detail the differences between the three. However, the overall message is clear: More is expected of people on the job than a large percentage of them feel should be expected. In these unique times, that requires follow up work or the numbers could look far worse a year from now.

Article Topics
Automation News & Resources
Beckhoff USA opens new office in Austin, Texas ASME Foundation wins grant for technical workforce development Walmart chooses Swisslog AS/RS and software for third milk processing facility Lucas Watson appointed CSO for Körber’s Parcel Logistics business in North America Kathleen Phelps to join FORTNA as chief financial officer Coles automates grocery distribution in Australia 2024 Intralogistics Robotics Survey: Robot demand surges More AutomationLatest in Materials Handling
Geek+ and System Teknik deploy PopPick solution for pharmacy group Med24.dk Beckhoff USA opens new office in Austin, Texas Manhattan Associates selects TeamViewer as partner for warehouse vision picking ASME Foundation wins grant for technical workforce development The (Not So) Secret Weapons: How Key Cabinets and Asset Management Lockers Are Changing Supply Chain Operations MODEX C-Suite Interview with Harold Vanasse: The perfect blend of automation and sustainability Consultant and industry leader John M. Hill passes on at age 86 More Materials HandlingSubscribe to Materials Handling Magazine

Find out what the world's most innovative companies are doing to improve productivity in their plants and distribution centers.
Start your FREE subscription today.
April 2024 Modern Materials Handling
Latest Resources